
Page Contents
- Candlestick Chart Pattern Game
- Welcome to the Candlestick Chart Pattern Game!
- ${question.question}
- Congratulations! You've completed the Candlestick Chart Pattern Game!
Candlestick charts, originating from ancient Japanese commodity trading, have become a pivotal tool in modern financial analysis.
These charts offer a deeper insight into market dynamics, providing more than just price movements but the psychology behind them.
Warren Buffett’s adage,
“The stock market is designed to transfer money from the Active to the Patient,”
highlights the importance of informed decision-making, where candlestick charts play a crucial role.
In this article, you will learn:
- The intriguing history of candlestick charts
- How to decode key candlestick patterns through detailed examples
- Practical tips to avoid common pitfalls in candlestick analysis
Join us as we delve into the art and science of candlestick charting, uncovering the stories told by each pattern and how they can guide your trading decisions
Historical Background of Candlestick Charts
The art of candlestick charting was not born in the bustling stock exchanges of the world. Instead, it originated in the rice markets of 18th century Japan. A legendary rice trader named Munehisa Homma developed these charts to track market conditions. He used them to follow price movements in Ojima, the rice market in the city of Osaka. His pioneering work laid the foundation for what would become a crucial tool in technical analysis.
Homma realized that the supply and demand of rice controlled prices. However, the emotions of the traders often influenced these two forces. By recording the opening, closing, high, and low prices each day, he could visualize market sentiment and predict future movements. His methods achieved great success. They were kept as a closely guarded secret among Japanese commodity traders for nearly two centuries.
Candlestick charting did not cross Japanese shores until the late 20th century. Steve Nison introduced it to the Western world through his seminal work, “Japanese Candlestick Charting Techniques.” This introduction marked a turning point. Traders around the globe began to embrace these techniques. They appreciated their ability to reveal market psychology and aid in decision-making processes.
This journey from ancient Japan to today’s digital trading floors illustrates the timeless value of candlestick charts. They serve not just as a tool for recording prices. They also act as a window into the emotional undercurrent of the markets.
Candlestick Chart Pattern Game
Welcome to the Candlestick Chart Pattern Game!
Learn about candlestick patterns by identifying them from images.
Understanding Candlestick Patterns
Candlestick patterns are the language through which traders can interpret market sentiments. Each pattern consists of one or several candlesticks. These patterns tell a story about the behavior of traders during a given timeframe. To fully utilize these patterns, understanding their basic structure is essential. It is also important to learn what they reveal about market dynamics.
Key Candlestick Patterns:
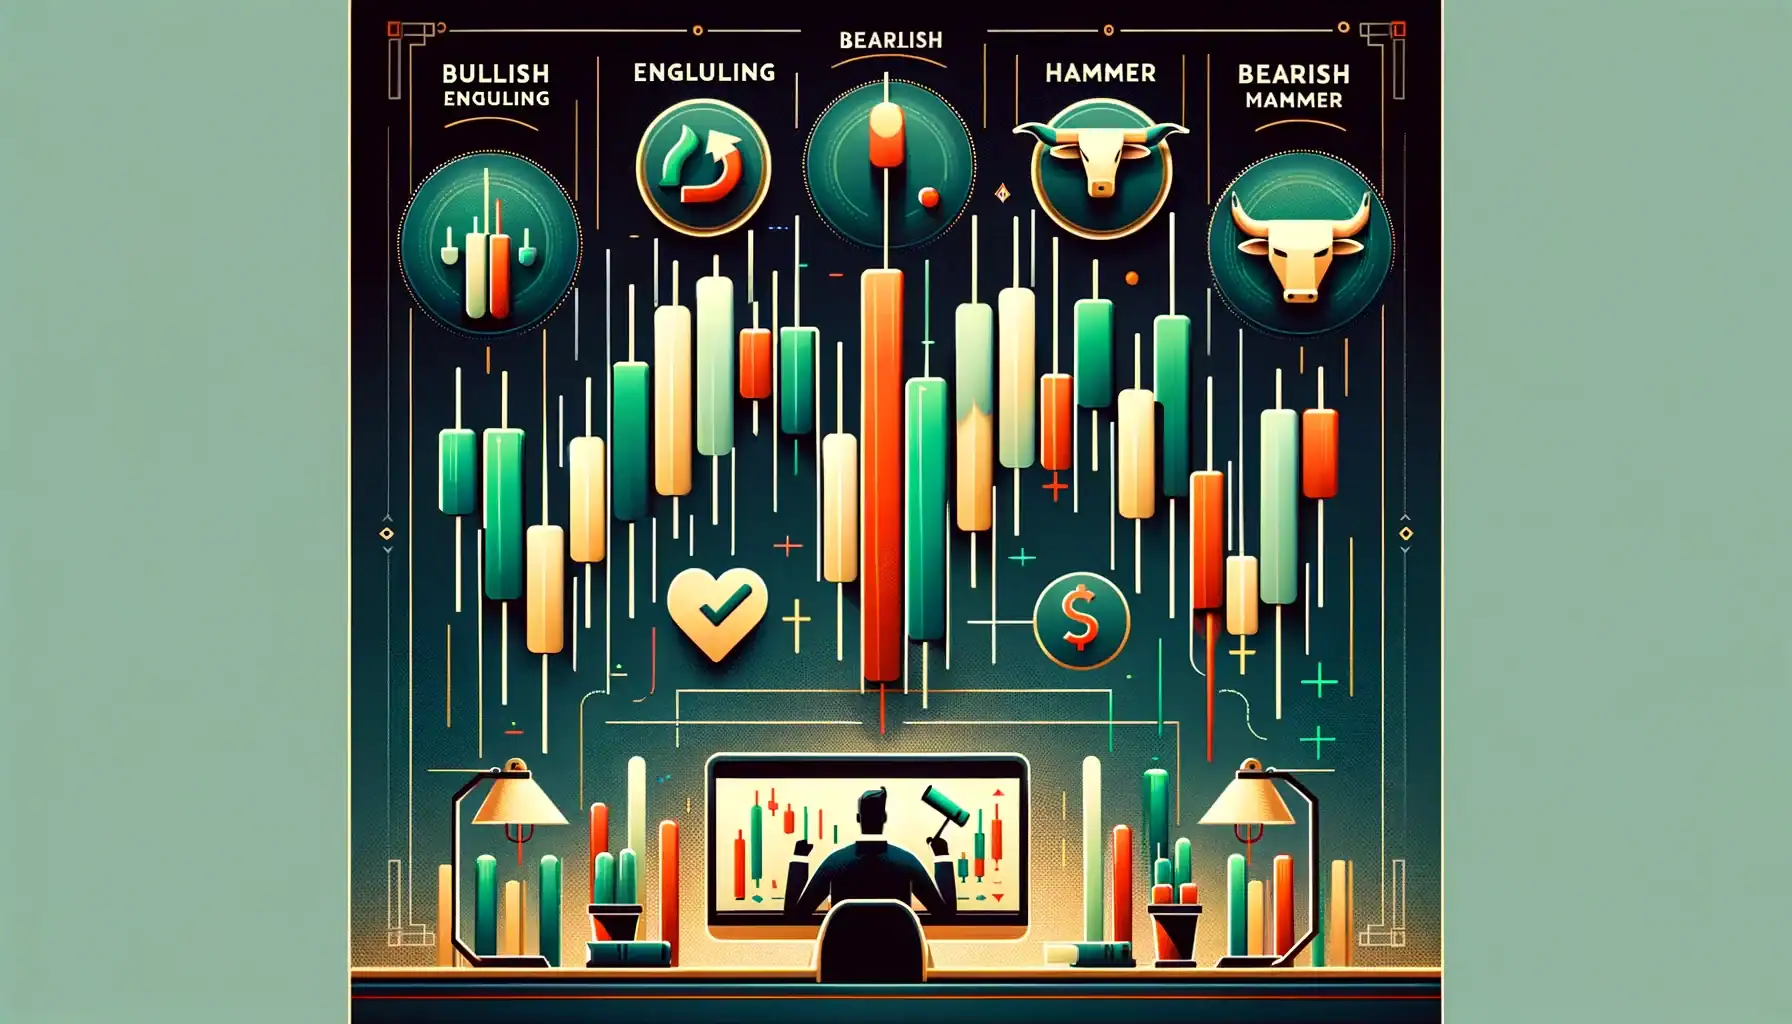
1. Bullish Engulfing Pattern: This pattern happens when a small bearish candlestick is followed by a large bullish candlestick. The bullish candlestick completely engulfs the previous day’s body. This pattern indicates a strong shift from sellers to buyers, suggesting a potential upward movement in the price.
2. Bearish Engulfing Pattern: This is the opposite of the bullish engulfing. This pattern features a small bullish candlestick. It is followed by a large bearish candlestick that engulfs the first. It signals a shift from buyers to sellers, hinting at a possible price decline.

3. Doji: Characterized by its thin body, a Doji candlestick appears when the opening and closing prices are virtually equal. It represents indecision in the market, suggesting that neither buyers nor sellers could gain the upper hand. A Doji after an uptrend may signal a reversal or a pause in the upward movement.
4. Hammer and Hanging Man: The Hammer and Hanging Man patterns both feature a small body. They have a long lower wick and a short or no upper wick. The Hammer, appearing after a decline, suggests a potential reversal to an uptrend. Conversely, the Hanging Man, appearing at the end of an uptrend, can indicate a forthcoming downtrend.
Each of these patterns provides clues to underlying market sentiments. Their reliability increases when combined with other technical analysis tools. For example, a bullish engulfing pattern with high trading volume offers a stronger buy signal. This is compared to the same pattern with low volume.
Reading Patterns in Context:
To effectively use candlestick patterns, traders must consider the broader market context. A bullish pattern in a predominantly bearish market might not indicate a complete trend reversal but rather a temporary rally. Similarly, patterns should be read with consideration of price trends, support and resistance levels. Other technical indicators should also be used to make informed trading decisions.
By understanding these patterns and their implications, traders can make more nuanced and informed decisions. They can align closely with market dynamics. This enhances their trading strategies.
How to Read Candlestick Charts Effectively
Reading candlestick charts is a skill that combines understanding individual candlesticks with a broader appreciation of market trends and psychological cues. Here’s a step-by-step guide to mastering this essential trading tool:
Step 1: Identify the Basic Elements
Each candlestick provides four key pieces of information. These are the opening price, the closing price, the highest price, and the lowest price during the timeframe. The body of the candlestic shows the range between the opening and closing prices. The wicks (or shadows) indicate the high and low prices. A candlestick where the close is higher than the open is typically filled in green or white, signaling buying pressure. Conversely, a candlesticwhere the close is lower than the open is filled in red or black, indicating selling pressure.
Step 2: Look for Patterns
After identifying the basic elements, the next step is to look for patterns over several days. Patterns can reveal the potential future movements in the market. For example, a series of consecutive green candlesticks with increasing lengths suggests a strong uptrend. In contrast, a series of red candlesticks might indicate a downtrend.
Step 3: Contextualize with Technical Indicators
Candlestick patterns are more reliable when supported by other technical indicators.

These include moving averages, Relative Strength Index (RSI), or volume metrics. For instance, a bullish engulfing pattern occurring above a long-term moving average may confirm a strong buy signal. In contrast, the same pattern below a moving average could be less persuasive.
Step 4: Consider Market Sentiment
Beyond just the patterns and indicators, it’s important to consider overall market sentiment. You should also think about external factors that could influence price movements. These include economic indicators or significant news events. This holistic approach helps in making more informed decisions.
Step 5: Use Diagrams for Clarity
Visual aids and diagrams can greatly enhance the understanding of candlestick charts. Below are examples of how different patterns can appear in real market scenarios, with annotations explaining each scenario:
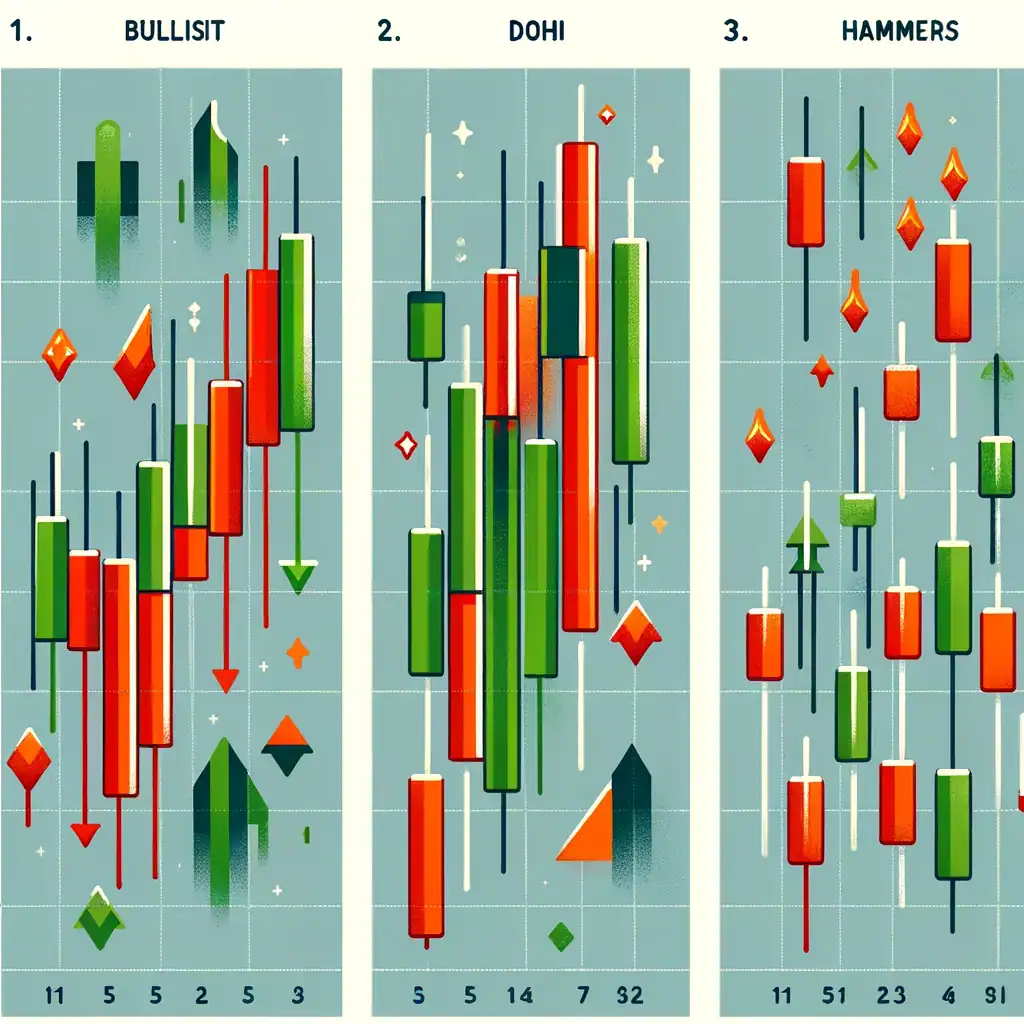
- Diagram 1: Bullish Engulfing Pattern at a key support level.
- Diagram 2: Doji at the top of an uptrend, signaling a possible reversal.
- Diagram 3: Series of Hammers indicating a potential bottom in market price.
By following these steps and continuously practicing reading candlestick charts, traders can improve their ability to gauge future market movements. They can also make more informed trading decisions.

Testimonial
“When I started trading, understanding candlestick patterns turned my trading around. It’s not just about the patterns but also the story they tell about market sentiment. Candlestick charts helped me see the market’s psychological dynamics and react before major price changes occurred,” says Alex Johnson, a professional trader.
Applying Candlestick Charts in Trading
Candlestick charts are not merely tools for viewing historical price data; they are instrumental in formulating trading strategies. Here’s how traders can apply the insights gleaned from candlestic charts to enhance their trading decisions:
1. Combining Candlestick Patterns with Trading Strategies
- Trend Following: Use candlestick patterns to confirm the continuation of a trend. For instance, a series of bullish engulfing patterns during an uptrend supports a buy strategy.
- Reversals: Candlestick patterns like the Hammer or the Bearish Engulfing can signal potential reversals. Traders might consider this an opportunity to enter or exit trades based on the reversal signals.
- Breakouts: Candlesticks can help identify consolidation phases which might lead to breakouts. Patterns like the Doji can indicate a tightening price range. Small bodies with long wicks often precede a significant price movement.
2. Psychological Insights
Candlestick charts reflect the psychological state of the market. Patterns like long lower wicks can suggest that despite selling pressure, buyers are beginning to dominate by the close of trading. This offers a key insight into buyer sentiment.
3. Timing Entries and Exits
Candlestick patterns can help traders time their market entries and exits more effectively, minimizing risk and maximizing potential returns.
For example, entering a trade following a confirmed bullish pattern and exiting when a bearish pattern emerges helps manage risk.
4. Risk Management
By understanding the volatility and sentiment shifts represented in candlestick formations, traders can set better stop-loss orders. A stop-loss might be placed just below a Hammer’s low in a bullish scenario. This placement provides a safety net against unexpected downturns.
5. Enhancing Decision-Making with Historical Data
Studying past candlestick patterns during similar market conditions can provide traders with a blueprint of potential market reactions. This analysis aids in more informed decision-making.
Practical Example:
Imagine a trader observing a Bullish Engulfing pattern after a significant downtrend with increasing volume. This might suggest a strong buyer’s return. If this pattern appears at a known support level, the trader might consider it a robust signal to buy. This is especially true if confirmed by a bullish RSI divergence.

By applying these strategies, traders can use candlestick charts as more than a retrospective tool. They can utilize them as a proactive mechanism to guide future trading decisions.
Common Mistakes to Avoid in Candlestick Chart Analysis
Candlestick charting, while powerful, can be prone to misinterpretation, especially by those new to trading. Awareness of these common pitfalls can significantly improve the effectiveness of this analytical tool.
1. Overreliance on Single Patterns
One common mistake is emphasizing a single candlestick pattern too much. This happens without considering the broader market context. For instance, a bullish engulfing pattern might seem promising. However, if it occurs during a strong downtrend without other supportive indicators, it may just represent a minor pullback. It may not be a true reversal.
2. Ignoring Volume
Volume plays a critical role in confirming candlestick patterns. A pattern without corresponding volume support may lack the momentum to follow through. Traders should look for volume increases on bullish patterns and volume decreases on bearish patterns to confirm their validity.

3. Disregarding Longer Timeframes
Focusing solely on short-term candlestick patterns without considering the longer-term trend can lead to misleading signals. It’s essential to align interpretations with the overall trend observed in longer timeframes to avoid contradictory trading decisions.
4. Misinterpreting the Market’s Stage
Candlestick patterns should be interpreted differently. It depends on whether the market is in a trend, range, or nearing a potential breakout. For example, a Doji in a trending market might indicate a reversal. In a range-bound market, it could simply signify indecision. It may also signal the continuation of the range.
5. Failing to Use Stop-Losses
Candlestic trading should always be accompanied by strict risk management practices. Traders often enter positions based on candlestick signals. They fail to set appropriate stop-loss orders. This exposes them to unforeseen reversals and market swings.
6. Lack of Practice
Finally, without adequate practice, traders may struggle to recognize and react to patterns swiftly. Utilizing demo accounts to simulate trading conditions can help build the necessary skills and confidence to apply candlestick analysis effectively.
Traders can leverage candlestick charts more effectively by understanding and avoiding these common mistakes. This approach reduces risks and enhances the potential for profitable trading.
Conclusion
Candlestick charts are more than just tools for visualizing price movements. They are windows into the psychological dynamics of the market.
Throughout this guide, we’ve explored the rich history of candlestick charting. It started in Japan and has been widely adopted in today’s global trading environments. We’ve decoded key candlestick patterns. We’ve also discussed how to read these charts effectively. Practical strategies have been provided for applying this knowledge in real trading scenarios. Additionally, we’ve highlighted common pitfalls and how to avoid them, ensuring traders can use these tools wisely.
Key Takeaways:
- Historical Insight: Candlestic charts have a centuries-old legacy that enhances their credibility and utility.
- Pattern Recognition: Understanding various candlestick patterns helps predict future market movements more accurately.
- Avoid Common Mistakes: Awareness of frequent errors can significantly improve the reliability of trading decisions.
As you continue your journey in trading, remember that mastering candlestick charts requires practice and ongoing learning. The complexity of the patterns and the rapid movements of the market demand a disciplined approach and a keen eye.
Next Steps: To further enhance your skills, consider enrolling in advanced technical analysis courses. These courses focus specifically on candlestick patterns. They also cover their applications across different markets. Additionally, engaging with trading simulations can provide valuable hands-on experience without the financial risk.
Call to Action
Your journey into the world of trading doesn’t have to be solitary. Join our community forum to discuss your experiences with candlestick charts, share insights, and learn from fellow traders. You can share your journey, whether you’re a novice aiming to understand the basics. If you are an experienced trader, refine your strategies to gain support. You can also gain new perspectives.
Feel free to comment below with your questions or share your experiences with candlestick charts. Let’s discuss and learn together!
FAQ Section
Q1: What historical significance do candlestick charts hold?
Candlestic charts were developed in the 18th century by Japanese rice traders. Their ability to visually represent emotional extremes in pricing makes them valuable in modern trading.
Q2: How do candlestick patterns reflect psychological market dynamics?
Candle patterns reveal the sentiment of the market. They show whether buyers or sellers are in control. They also indicate potential shifts in momentum and market direction.
Q3: Can I use candlestick charts for all investment types?
Yes, candlestick charts are versatile and can be applied to stocks, forex, commodities, and even cryptocurrencies to gauge market sentiment.
Q4: What are the top three candlestick patterns every trader should know?
The top three patterns include the Bullish Engulfing, Bearish Engulfing, and the Doji. Each pattern provides key insights into market trends and reversals.
Q5: How do I combine candlestick charts with other forms of technical analysis?
Combining candlestick charts with technical indicators like RSI, MACD, or moving averages can provide a more robust analysis. This confirms trends and reversals identified by candlestick patterns.
Q6: What time frames work best with candlestick charts?
Candlestick charts are flexible and can be used on any timeframe. You can use them from very short periods, like 1-minute charts, to long-term periods, like monthly charts. It depends on your trading strategy.
Q7: Are there any candlestick patterns that indicate a reversal with high accuracy?
The Hammer and Inverted Hammer in a downtrend are highly regarded for their reversal indications. Likewise, the Shooting Star and Hanging Man in an uptrend are also valued for their reversal signals.
Q8: How important is volume in interpreting candlestick charts?
Volume is crucial as it confirms the strength behind a candle pattern. High volume during a pattern formation suggests a stronger and more reliable market signal.
Q9: What are some common misconceptions about candlestick patterns?
A common misconception is that candlestick patterns are foolproof predictions of future market movements. In reality, they should be used as indicators alongside other analysis tools.
Q10: How can I practice candlestick chart analysis safely?
Practicing with a demo trading account allows you to simulate trading scenarios using candlestick charts. This method carries no financial risk. It helps in building your skills and confidence.
Discover more from Financial Freedom with Sakkemoto
Subscribe to get the latest posts sent to your email.
Normally I do not read article on blogs however I would like to say that this writeup very forced me to try and do so Your writing style has been amazed me Thanks quite great post
Thank you for your kind words! We’re glad to hear that our article on candlestick trading patterns caught your interest. It’s wonderful to know that you enjoyed our writing style and found the post valuable. We aim to make complex topics accessible and engaging for our readers. Stay tuned for more insightful content!
Thank you for the auspicious writeup It in fact was a amusement account it Look advanced to far added agreeable from you However how can we communicate
Thank you for your kind comment! I’m glad you enjoyed the writeup on candlestick trading patterns. If you have any questions or would like to communicate further, feel free to reach out through our contact page on the blog or leave a comment here. We’re always happy to help and discuss more insights with our readers!
Hey, I must say, I’m thoroughly impressed by your article on the subject! The way you articulated the key points was not only clear and engaging but also incredibly informative. It’s evident that you have a deep understanding of the subject matter. One of the things that struck me the most was your unique perspective on the topic. I’ve come across this topic before, but the way you presented it shed new light on the matter. Your explanation was so compelling that it has completely shifted my thinking on this aspect. Kudos to you for providing such valuable insights! I also want to commend you on how you tackled your blog. The examples you used were spot-on and really drove home the practical applications of this concept. It’s not often that I come across an article that manages to balance theory and practice so effectively. I’ll definitely be implementing some of these ideas in my own work. Another highlight of your article was the way you broke down the article. I’ve always found this topic to be quite complex, but your explanation was so clear and easy to follow. You have a real talent for taking intricate ideas and making them accessible to a wider audience. In summary, this article is an absolute gem. It’s a comprehensive resource that provides an in-depth look at the entire topic. I’ve already bookmarked it for future reference and will be sharing it with my colleagues and clients. I know they’ll find it as valuable as I did.Thank you for putting together such a well-researched, thought-provoking, and engaging piece of content. It’s rare to come across an article of this caliber. I’m excited to dive into more of your work and see what other insights you have to offer! Keep up the fantastic work! Best regards,
Thank you so much for your incredibly detailed and encouraging feedback! I’m thrilled to hear that you found the article on candlestick trading patterns both engaging and informative. It’s wonderful to know that the unique perspective and practical examples resonated with you and even shifted your thinking on the topic.
Your kind words about the balance of theory and practice and the clarity of the explanation mean a lot. We strive to make complex subjects accessible and useful to a wide audience, and it’s rewarding to hear that this approach has been effective for you.
I’m glad you found the content valuable enough to bookmark and share with your colleagues and clients. Your support and engagement are greatly appreciated. I look forward to providing more insights and high-quality content in the future. Thank you again for your thoughtful and comprehensive feedback!
This article was a fantastic read! I appreciate the depth of information and the clear, concise way it was presented. It’s evident that a lot of research and expertise went into crafting this post, and it really shines through in the quality of the content. I particularly found the first and last sections to be incredibly insightful. It sparked a few thoughts and questions I’d love to explore further. Could you elaborate more on next time? Also, if you have any recommended resources for further reading on this topic, I’d be grateful. Thanks for sharing your knowledge and contributing to a deeper understanding of this subject! I dedicated time to make a comment on this post immidiately after reading it, keep up the good work and i will be checking back again for more update. i appreciate the effort to write such a fantastic piece.
Thank you so much for your detailed and encouraging feedback! I’m thrilled to hear that you found the article on candlestick trading patterns informative and well-presented. It’s great to know that the first and last sections were particularly insightful for you.
I’d be happy to elaborate further on the topics you’re interested in next time. If you have specific questions or areas you’d like more information on, please let me know, and I’ll make sure to include them in future posts.
For further reading on candlestick trading and market trends, here are a few recommended resources:
“Japanese Candlestick Charting Techniques” by Steve Nison – A comprehensive guide to understanding and using candlestick charts.
“Technical Analysis of the Financial Markets” by John Murphy – Covers a wide range of technical analysis tools, including candlestick patterns.
Investopedia’s Candlestick Charting Basics – Offers a good online overview of key candlestick patterns and their interpretations.
Thank you again for your kind words and support. I look forward to providing more valuable content and insights. If you have any more questions or topics you’d like to explore, feel free to reach out!
[…] Candlestick Explained: Unlocking Market Trends with Key Trading Patterns! […]
Your blog has quickly become one of my favorites. Your writing is both insightful and thought-provoking, and I always come away from your posts feeling inspired. Keep up the phenomenal work!